

My Trading > My Trading Journal
My Trading Journal
October 27, 2015 - 9:00 pm (PST)
Joe Rogan - buy Fogo De Chao. It is growing at 12% per year and selling at 14 times earnings. The stock came IPO in the summer and is down by almost 50%. This is where smart money buys. Check out thee chart below.

September 14, 2015 - 7:00 pm (PST)
A good low-risk, long-term opportunity has presented itself with a couple of well-known, well-liked companies - WalMart (WMT) and Procter & Gamble (PG).
Normally, I would publish a well-detailed analysis of the value of the companies based on valuation ratios. I am not going to do that in this case, for a couple of reasons. First, these companies are very popular, so their business characteristics are already known. And second, these are long-term plays, so the ultimate price targets will vary based on what happens over the next couple of years. Although I won't get into a detailed comment on their valuation, WMT does have a high valuation - especially considering the stock has dropped so much.
Here is a quick list of the advantageous characteristics of their businesses:
- Both are large companies with a lot of public information.
- Both are category leaders.
- Both have long operating histories.
- Both have very simply business models which do not have much strategic risks.
- Both operate in industries where they sell basic goods, so their business have a strong visibility in the future.
- Both are very large companies, so their financial performance is very stable, which lends itself to stable stocks.
Both companies have high dividend yields - 3.0% (WMT) and 3.9% (PG). Both companies are also raising their dividends yearly.
Here are the 2 charts:


If we simply use the old price highs for the stock as long-term price targets, we can calculate the projected returns, as deailed in the table below:
| Stock | Current price | Price target | Projected return |
| WMT | 64 | 89 | 39.1% |
| PG | 68 | 91.5 | 34.6% |
Projected returns
It took about 9 months for these stocks to drop form their 52-eek highs to their current levels. Therefore, it should to take too long for them to go back up to those levels. Since volatility tends to be higher when stocks drop than when they rise, it will take more time for these stocks to go back up than they did to go down. Therefore, it would be prudent to expect a minimum of 1-2 years before these stocks reach those old highs. If we calculate the returns based on a 2-year recovery rate, we get the following annualized returns:
| Stock | Stock return | With dividend yield added |
| WMT | 17.9% | 20.9% |
| PG | 16% | 19.9% |
Those returns are very attractive, considering how low-risk these stocks are. If we look at a worse-scenario, here are the returns if the stock take 5 years to recover.
| Stock | Stock return | With dividend yield added |
| WMT | 6.8% | 9.8% |
| PG | 6.1% | 10.0% |
Even if it takes 5 years to recover, you still get a 10% return for these stocks. Although these returns don't seem too attractive, these are worse-case scenarios. These particular stock ideas should appeal to investors who are very risk-averse and looking for a lower-risk stock investments which will have a lower volatility and lower chance of losing money. In a world where the historical 10% returns sees to be a thing of the past, these returns will appeal to long-term investors looking to rely on a double-digit return which they can use to model their portfolios value longer-term.
September 13, 2015 - 6:00 pm (PST)
A possibly great opportunity presents itself with Yandex - a Russian internet stock. The stock is down about 75% from its 2-year high. If the stock recovers to only its 52-week highs, it is an easy double. That's the quick story. So lets look deeper at the valuation and other factors.
The Fundamentals
The earnings estimates are about $0.56 and $0.68 for this year and next. Here is a link to the Yahoo Finance estimates. They are stated in Rubles. You can do a currency conversion here with Bloomberg.
The growth rate is 17%. If we apply a multiple of 17 to the $0.68 earnings estimate for the soon-to-be-here year, we come up with a valuation of $11.50. If we add in the $1 net cash on the balance sheet we come up with $12.50. Although this is a little higher than the current price, it is not much higher. This is very surprising, given that the stock was so much higher before. Next, I looked to see if the estimates had come down by a lot. But they didn't. Next, I looked to see if earnings were much higher in previous years. But they weren't. The last thing I checked is to see if the company had a higher rate of free cash flow than earnings, which is common for high-tech companies. But they didn't. Any one of these factors would have pointed to a situation where I could assign the stock had a better valuation (if the FCF was higher), or expect the valuation would improve in the future (if the earnings were expected to rebound). But neither is the case here. From a mathematical standpoint, this implies that the stock was simply very overvalued in the past, and is now only fairly valued, despite the huge drop - unless I was missing something. Which I was. The value of the ruble had dropped in half over the past 2 years, so the fair value would be $25 if the Ruble had its value from 2 years ago...
The Ruble
The Ruble is down because the Russian economy is suffering. And the Russian economy is suffering because the price of oil has been dropping. So, the outlook for the Ruble will generally be tied to oil. What's my outlook on oil? Well, it is basically neutral. It could take a decent jump up by $10-$20 against the universal trend of bearishness. It could drop another $10-$20 to $20-$30. Or it could trade sideways.
The Technical Picture
The stock is down a lot and oversold. It is probably due for a short-term bounce, long-term trends aside. Here is a chart:

Bottom Line
I am holding off on buying Yandex. This says a lot since I am not afraid at all to buy a stock when things look very ugly. But in this case there are 2 main reasons.
The first is valuation. When I first saw that YNDX was down near 11, I thought it would be very undervalued. But it isn't. Then, I thought I could find a reason for the valuation to be compelling in the future. But I couldn't find a substantial reason.
The second reason is that there are simply too many factors which could have a large negative impact, including: political risk (general Russian dysfunction), currency risk (the falling Ruble), oil prices, economic risk (the worsening Russian economy). This is aside from general business risk (such as competition).
Although I am holding off on buying the stock, this is not necessarily a claim that the stock won't go up. The stock may very well double in a year or less. It's possible that all of the above problems have been factored into the sock already. When it comes to beaten-down stocks, it is generally true that the stock rebounds before the fundamentals. I do think the stock does has a lot of upside here. But there are simply too many risk factors that make the risk/reward ratio unfavorable. This is in addition to the fact that I don't know the company well, so there is familiarity risk.
I am also not averse to trading YNDX in the short-term, if it were to fall another $1 or more.August 13, 2015 - 6:00 pm (PST)
In my section on stocks, I talk about trading IPOs. I talk about the different reasons why IPOs are difficult to analyze, as well as the opportunities they present. One recent IPO is a great example of everything I talked about: David's Tea (DTEA)
Description
David's Tea is a company based in Canada which operates retail tea locations. It has 161 total locations with 136 in Canada and 25 in the United States as of mid-2015. All stores are company-owned. The fact that the company operates in the tea industry is notable for a couple of main reasons: first, tea is the 2nd most popular beverage in the world behind water; and second, the retail tea industry is very underdeveloped commercially. No company has an established national brand of retail tea stores, and David's Tea only has 25 locations in the U.S. So, this situation appears to be similar to past opportunities in that there is (1) a big market, and this big market is so-far (2) underdeveloped.
Tea Industry - Cautionary Notes
A few people have made a reference to David's Tea as being the "Next Starbucks". These comments are way too premature to be taken seriously at this point. Firstly, the tea market is not as commercially viable as the retail coffee market. I don't think the tea market in 2020 will be the same low-hanging fruit that coffee was in 2000. Secondly, Starbucks already has a tea brand called Teavana. So, the "Starbucks of tea" may very well be Starbucks. Additionally, management of David's Tea have so far given very restrained goals for store growth targets. Their targets represent a 200-300% target, but this is far from the 10,000 store count which would allow DTEA to be classified as a mega-growth story.
Technicals
The IPO was issued at $19 and traded past $27 on its first day. It peaked at $30 in its first week. It has fallen straight down since then and reached a low of about $12.50 today. It is down 60% in 2 months. You can see this in the chart below. For a profitable company that is growing very quickly, this is very attractive.

Fundamentals
The next question is: What is the stock worth? To start, let's look at the earnings estimates for this year and next year:
| Source | FY '15 | FY '16 |
| MarketWatch | $0.30 | $0.52 |
| Zack's | $0.31 | $0.61 |
| WSJ | $0.30 | $0.52 |
Here is a link detailing DTEA's recent financials - including 22 consecutive quarters of positive same-store growth, a 50% CAGR for revenue, and a 68% CAGR for EBITDA.
Given that earnings estimates are about $.30 and $0.55 for this year and next, and the revenue growth rate is about 30%, one could apply a P/E of 30 to those earnings and get a value of about $10. If I use next year's earnings level and assume the growth rate will generally be the same, then I come up with a value of $16.50 ($0.55 X 30). This is roughly a 22% return in 1 year.
Instead of using earnings, I could use cash flow (either free cash flow, or operating cash flow) and use cash flow ratios instead of P/E ratios. A couple of days ago, I found some cash flow predictions for DTEA (which I can't find right now), but the valuation based on cash flow was not any more attractive. Even though it is common for free cash flow (FCF) to be higher than earnings (and therefore allow a higher valuation), growing companies often have a lower FCF than EPS since they have to spend so much on capex in order to fund their growth. I would assume this is the case with DTEA.
Given that none of these valuations have been very attractive so far, It may help if we look at the numbers from a different viewpoint.
We could look at the year-over-year earnings growth of 83% and use that as a P/E ratio against this year earnings of $0.30. This gives us a value of $25, which is in-line with the highs of the stock over the past couple of months. This earnings growth rate is particularly aggressive since the company is coming off of a low base of earnings of only $0.30. This can inflate the growth rate since the additional earnings result in such a large percentage rise. This high growth rate will come down next year because it will have a higher base of earnings of $0.55. But this is fine because the lower P/E (based on the lower growth rate) will be offset by the higher earnings. If I were to value the stock a year from now, I could value it by multiplying the 2016 EPS of $0.61 X a proposed 2016 EPS growth rate of 40% (cutting the growth rate in half). After doing this, I get $25. So, after giving the stock a more-reasonable PE ratio, we get the same number roughly.
Targets: Value and Price
The value target is roughly $25 per share, as per the analysis above. As far as the price target goes, given the fact that the stock recently traded at $30, this means the market has valued the stock at this level before. It is not unreasonable then, to expect the market to value it again at this level a year from now, especially since the company will have another year of 30% growth under its belt. Normally, I wouldn't use the market's past trading level as a reliable indicator for the future, but for a high-growth company, it is uncommon for a stock to not reach its old highs. So, given a price target of $25-$30, this implies a 100% return or so in the near future.
Even if market conditions turn negative and the DTEA stock takes 2 years to hit its target, a 100% return in 2 years still represents a very attractive 41% compound annual growth rate. Furthermore, if the current negative investors' sentiment turns positive, additional returns in valuation expansion are very possible. Since there are fewer reliable high-growth consumer brand names for growth-oriented investors to be able to count on, it is common these days for growth stocks to go straight up for multiple years. It would not be surprising if DTEA stock becomes a growth darling in the future and turn into a 5-bagger in 3 years.
Random
Note 1: Some of their financials may be quoted in Canadian dollars so make sure you do a conversion to the US Dollar before analyzing their numbers.
Note 2: Fidelity has been shown to be a big buyer of DTEA stock recently. This is notable because Fidelity has traditionally been a large buyer of growth stocks, and sustained buying by Fidelity has been perceived by some investors as a reason for bullishness. Personally, I'm not a big believer in the strategy of tracking institutional cash flow in-and-out of individual stocks.
December 28, 2013 - 6:30 pm (PST)
Here is a nice quick article in Barron's about the high economic growth rate in Africa. I find these kinds of articles particularly useful because it is somewhat difficult to keep an eye on the economies and stock markets of foreign countries (unless you specialize in international investing). This difficultly is compounded by the fact that there is no resource where you can check up on quick-and-dirty statistics about the economic fundamentals of foreign countries (that I am aware of anyway).
But the above article only talks about the fundamentals. You also need to take a look at the charts to get the technical picture. For example, if the market is up 100% for the year-to-date, then the market may have already priced in this attractive growth. We'll use the African ETF EZA (iShares MSCI South Africa Index) as the vehicle to analyze this trade idea.
In the chart below, you can see that the market is mostly attractive, for a few reasons:
- The ETF has been in a trading range for 4 years, between 55 - 78.
- It is in the bottom half of this trading range.
- Longer-term. Although the ETF is up a lot from its 2008 low, it is still at the same price as it was back in 2006.

In order to get the full picture, you also need to see what the P/E ratio is in order to see if the valuation ia attractive. Most times, I don't even do this, for a couple of reasons. Firstly, valuation (or earnings) statistics are not readily available for countries as a whole. And secondly, whenever you are presented with an economy that is growing very quickly but has a stock market that is under-performing (by trading in a very long trading range, or better yet, selling at multi-year lows), you can bet on that market going up over the intermediate term.
I posted a similar journal entry about the Vietnamese stock market about 2 years ago, which was in a somewhat similar position. This was the ideal situation where you are buying an economy with a high growth rate that is selling at multi-year lows. Although the ideal situation would be for the African stock market to drop 20% or so and trade at multi-year lows, you can still buy it today without the market being overbought at all.
October 27, 2013 - 5:21 pm (PST)
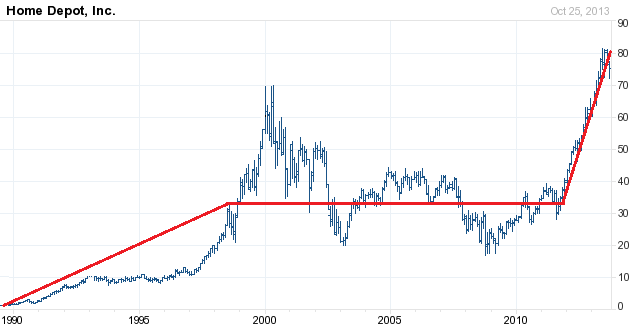
One of the patterns you can use to find high-quality long-term buys in the market is when a market or company that is a steady grower has a stock that trades sideways for a long time. The first example I will use is Home Depot (HD). If you look at the chart below, you will see the stock trade sideways from 1998 until 2012 while their revenue and earnings were growing steadily. After the stock broke out of this sideways trend, it went up from 35 to 80 - about 115% in 2 years.
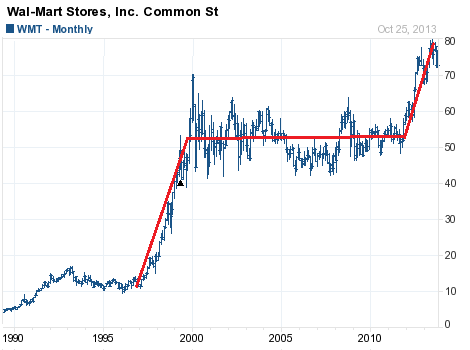
The second example, Wal-Mart (WMT), is shown in the chart below and is essentially a carbon copy of the Home Depot example. Both of these stocks were large cap stocks that went up too much in the late 90's as a result of the dot-com boom. Each stock had to consolidate sideways for about 5 years in order to digest those large gains. But, in these particular cases, the stocks ended up "over-consolidating" and trading sideways for too long. Hence, the underlying value of each of these companies ended up surpassing the price, and the price later jumped up quickly in order to catch up.
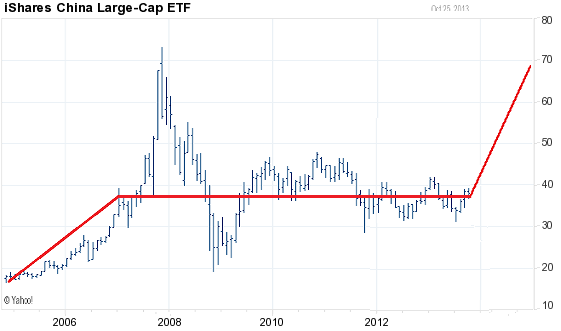
Fast-forward to today...One particular market that has been a steady grower is China. Their economy has maintained an 8-10% GDP growth for quite some time. In the chart below, you can see how the Chinese market (indicated by FXI, a Chinese ETF) ran up a lot from 2004 to 2008. But the market has been trading sideways for almost 7 years now. I'm not sure if the market is going to break out now or later. But given that the market is still in the bottom half of its 30-50 range over the last few years, this is not a bad entry if someone is looking to for an attractive buy-and-hold with a low-risk entry. If the market does break out to the upside, I would look for it to jump from its current 38, to about 65 - for about a 70% gain. With good momentum, it could do it in 1.5-to-2 years.
October 4, 2013 - 9:00 pm (PST)
There as a very good SeekingAlpha article by author "PropThink" about DiaDexus. (DDXS), a company that makes a patented blood test called the "PLAQ test" for heart disease. I meant to post this back on July 11th, but didn't get around to it until now.
This guy does a very good job of intelligently analyzing a stock by framing the analysis in terms of the EV ("expected value") of different valuation scenarios. This is a technique that I only use occasionally. It benefits you most when you are looking at a situation where there is a wide disparity in possible values in different scenarios. This technique doesn't have much value when doing an analysis of scenarios which will only have a marginal effect on the value of the stock. Biotech stocks awaiting an influential FDA approval are probably the most relevant example. But this is a technique that most analysts (and traders) do not use - and is a technique that is particularly ignored by bio-tech stock investors, who are probably the most valuation-ignorant sub-group of investors there is.
I am very up-to-speed on LP-PLA2 and the market and products relating to it (including Darapladib), and I do agree with him on just about everything he said, but I have one major disagreement with his analysis:
"Essentially, the diagnostic would likely be added to the standard battery of tests suggested for patients at risk for cardiovascular disease."
I think this prediction is completely wrong. I'm not sure how familiar he is with the hs-CRP test for cardiac health, but it is a test that has proven to be extremely useful in helping diagnose heart problems. It has been shown to be better than standard cholesterol tests (LDL, HDL, etc). The literature on the CRP tests goes back to the 1980s, and there have been tons of studies done over the last 20 years that have proved the benefits of CRP testing. Yet, despite these undeniable benefits, very few doctors recommend CRP testing, even though it only costs about $45 (lower than the $150 PLAQ test by DiaDexus).
There is one particular reason why the majority of doctors don't recommend CRP testing. They simply don't care. Most doctors are happy being stuck in their 1980's mindset where LDL and HDL testing is all you need. Having a public that is illiterate with regard to basic health issues is a benefit to them. The public likes to idealize doctors as a group of people who are interested in intellectually pioneering new roads in medical research and health treatments. Personally, I take the opposite view. I think most doctors are lazy - and are no different than other groups of workers as a whole, and most of them are content with merely being mediocre at their jobs.
The approval of Darapladib would indeed lead to a healthy increase in the growth of the PLAQ test and it's resultant revenue, but this growth will not be explosive growth. And this is because there will be no revolution in the way the medical community treats heart disease - or even the way they think about heart disease diagnosis.
August 28, 2012 - 6:03 pm (PST)
NEW TRADESI added 4,300 (SPLS) Staples shares at 10.73. I have 22,800 shares at an average of about 10.91. I'm only looking for a 30 cent pop so I can make about $7,000 in 1 week.
While on Morningstar today, I decided to check to see if they had published a valuation of Facebook stock. Indeed, they had. I was somewhat surprised at this because Morningstar is not the kind of company that concentrates on trendy stocks. Granted, Facebook does multi-billions in revenue and is a genuine company, but they only went public recently and Morningstar likes to have comprehensive financial data in order to do their financial modeling. Companies that have recently completed IPOs tend to have not have very long historical financial data available to the public.
Furthermore, I was even more surprised that Morningstar had given Facebook stock a very high valuation. You can see below a quote from their report:
"We value Facebook at $32 per share...Our valuation represents a multiple of 59 and 71 times our 2012 earnings per share and free cash flow estimates, respectively."Not only are these multiples of 59-71 very high (since Facebook's growth is clearly in the 25-30% range), but these multiples are also very high considering that Morningstar has always been very conservative when assigning valuation multiples to growth companies. They have done a very good job in the past in avoiding the mistake of assigning high valuation multiples to companies that are growing very quickly but are about to "hit the wall" on growth. Over the past 2 years or so, I saw Morningstar assign Netflix (NFLX) stock a value of $150 when the stock was trading at $276. They did a similar analysis on OpenTable (OPEN) where they assigned the stock a value of $40 when it was trading at $111. They are not afraid to assign a down-to-earth multiple in the face of huge growth and positive investor sentiment when they believe the market is over-valuing that growth.
Furthermore, in their report they made a comment where they gave their opinion about the direction of Facebook stock in the short-run:
"We still believe the company is likely to disappoint investors for the next several quarters. While we are not intending to call for short-term moves in the stock, we do believe that slowing growth and declining profitability may cause the stock to trade significantly below our fair value estimate."Although I do not have a problem with analysts stating their opinion about a stock's direction in the short-run - or making a long-term recommendation that contradicts their short-run opinion - Morningstar, in my experience, has never gave their opininon about the short-term direction of a stock. As a matter of fact, their whole style of analysis is specifically designed to ignore these short-term issues. Most of their equity valuation is based on discount cash flow (DCF).
Morningstar's high valuation multiple on Facebook stock, combined with their comment on the short-term direction of the stock, makes their report very curious. Although the hype around Facebook stock has created a flurry of interest among traders, it has also created a flurry of interest among financial publishers. I get the feeling Morningstar may have succumbed to the pressure for content publishers to create content specifically to meet the demand of people wanting to read about Facebook stock. Although I consider Morningstar to have the highest integrity among all investment publishers (except for myself, maybe), this is one example where I think they may be biased.
August 24, 2012 - 6:31 pm (PST)
Sold 229 HPQ (Hewlett Packard) September 15/16 put spreads at 0.15.August 23, 2012 - 4:49 pm (PST)
POSITIONS - UPDATE:- ANN was even.
- DELL was down almost 4% to 11.24. It's getting close to my strike of 11, but still not a big worry.
- SNE was down a bit.
POSITIONS - NEW:
I sold 150 December 10/11 put spreads at 0.40 on Staples (SPLS). At 0.40, the return on the trade would be 66% in 4 months. The downside is that the spread is close to the market so I could easily get exercised. But I don't think I would mind if that happened. The longer-term length of this trade (compared to my typical 1 to 2 month option writing) has 2 advantages. First, I don't have to worry about getting my money tied up in an exercise for a while. And, secondly, it gives a while for the stock to recover.
SPLS is a stock I know well. I lost almost $26,000 on a 15/16 out spread back in May. Then made $3,000 on a credit spread a month later. Then broke even on another put spread a month later. I also made about $3,400 on a swing trade last week. I might try to get filled again tommorow.

I also bought 18,500 shares at 10.96. I'm not looking for a large move. Even a 2-3% move in 2 days would be a $3,000-$5,000 profit.
OTHER:
I tried again to get filled on Under Armour (UA) but didn't.
Facebook was about even. Normally, I don't care about trading a high profile stock. But Facebook is oversold, and will be undervalued if it trades down to 15 or so. Also, Facebok is a particularly volatile stock, so if it drops down to 15 very quickly, I think it could easily bounce up 10-20% to 17-18 in only a few days. Although there is tons of Facebook stock bashing going on right now, there is also an undercurrent of silent interest building in the stock here.
Hewlett-Packard (HPQ) was down a lot after-hours yesterday. I thought about buying the stock today, but I actually slept thru the whole market today. Tommorow I may put on a put credit spread. I actually currently have on a 100 September 21/22 call credit spreads right now. I could write the put spreads without having to post additional margin.
August 22, 2012 - 10:54 pm (PST)
UPDATE:ANN traded down today - less than 1%. Only a 29 cent pullback after a 7 dollar rise in 3 days. But the important thing is that the stock made a reversal. It traded up and closed down. It looks promising going forward. See the chart below with today's drop in red.

NEW TRADES:
With Sony near it's 25-year lows, I wrote 100 of the September 10/11 put spread at 0.12. This trade makes me nervous for 2 reasons. First, Sony is a company with deteriorating fundamentals. And, second, I lost about $17,000 on a 14/15 put credit spread I wrote back in May. But this is not a large trade. It is only about a quarter of what it could have been. You can see in the chart below the drawn in lines for the expiration date and strike price for the spread.

Dell is in a similar situation - near multi-year lows. I wrote 100 September 10/11 put spreads at 0.15. I had already written a 100-lot of the same spread for the same price back on August 8th. I probably won't mind getting exercised on this spread if I have to. You can see the chart below the drawn in lines for the expiration date and strike price for the spread.

Both of these SNE and DELL trades are roughly 7% out-of-the-money.
ALMOST NEW TRADES:
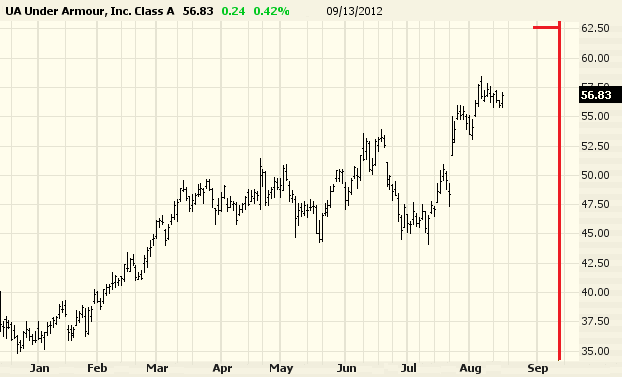
There were 2 other credit spreads I tried to put on but didn't get filled. One was selling a 150-lot of the December 10/11 put spread at 0.40 on Staples (SPLS). The other almost-trade was an order to sell 65 September 62.50/65.00 call spreads at 0.22. See the chart below.
UPDATE: Facebook. Although I posted yesterday about the failed re-test of the 20 level, it is also possible that Facebook could be setting up for a head-and-shoulders bottom - and the break to a new low of 19 could have been the final bottom. The next couple of days will probably tell. See chart below.

August 21, 2012 - 11:51 pm (PST)
ANN was up today 79 cents to 35.14 - not a big deal so far.Yesterday, Facebook (FB) rebounded off it's low of 19 and gained 5% to 20 and had pretty strong day. It was a re-test of the break-thru of 20. Today, it traded back down near 19. So far, it has failed the test. This implies it will continue with it's short-term downtrend which I pointed out in my journal entry on August 19th. Here is an intra-day chart showing the breakdown and failed (so far) re-test of support.

August 20, 2012 - 4:23 pm (PST)
ANN Taylor (ANN) is overbought. It gapped up from 28 to 34 last Friday, and traded a bit higher today. The stock is also over-valued. I sold 200 September 37/38 call spreads @ 0.12. The premium collected is $2,358. The total risk is $17,642. The maximum return is 13.4%. This is a very ice return considering that the stock is 7.7% out-of-the-money with only 4.5 weeks until expiration. Typically, you will see a return of about 5-7% return in this situation. You can see in the chart below where the expiration and my strike price is.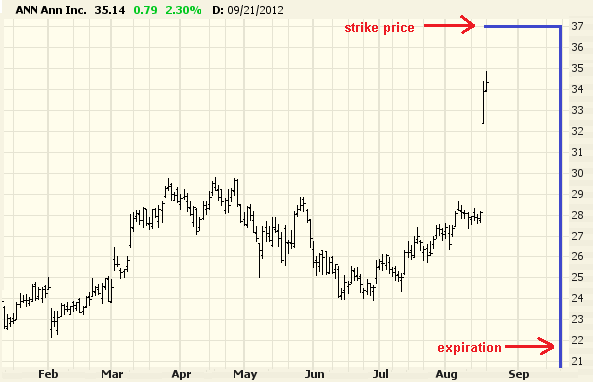
I also tried to get filled on a Undar Armour (UA) 62.50/65 call spread but missed. I was hoping GPS would come back up but it didn't.
August 19, 2012 - 9:22 pm (PST)
The Gap (GPS) stock is making one of the best chart set-ups that I know of. It a pattern where there is:- A large 1-day move in a certain direction.
- Then a 5-day (or so) continuation of small moves in the same direction without any kind of pullback.
- Then another large 1-day move in the same direction.
I haven't ever named any of my personal chart patterns but I think I may start, just for the sake of clarifying and classifying my chart patterns and trades. This pattern is called the "1-5-1" pattern. You can view a model of the pattern below, and the pattern on the Gap chart below:


The fact that the Gap stock is fundamentally overpriced makes this situation almost a must-trade. I'm not sure if I will short the stock and look for a 3-to-5% gain in a few days, or write a call credit spread. Here are some of the call credit spread profit opportunities for the weekly, September, and December options. October options will being listing tommorow I believe. The option premiums seem really high. The 38/39 Sep call spread is about 6% out-of-the-money (equal to a 288% annualized move), but it pays you 24% profit. An at-the-money (ATM) call spread pays you about a 90% profit for 1-month.
| EXPIRE | STRIKES | PRICE | PROFIT |
|---|---|---|---|
| weekly | 36/37 | 0.37 | 57.0% | weekly | 37/38 | 0.12 | 12.7% | September | 36/37 | 0.48 | 89.8% | September | 37/38 | 0.29 | 40.5% | September | 38/39 | 0.20 | 24.7% | December | 36/37 | 0.48 | 91.6% | December | 37/38 | 0.39 | 63.4% | December | 38/39 | 0.32 | 46.6% |
August 19, 2012 - 6:45 pm (PST)
Since Facebook stock has dropped from about 35 down to 19, it has become oversold, which puts it on my radar for stocks to look at. A few weeks ago I posted that the stock was worth about 19, so the stock is not currently undervalued - even though it is oversold.The interesting thing about the chart (see below) is that the stock just convincingly broke below the previous support level of 20.

So if the stock continues to drop, it will be come fundamentally undervalued, as well as severely oversold, which is the perfect setup for a swing trade. The obvious question is "what price will the stock drop to before it bounces?". On my trading IPOs page I point out that "the lack of trading history [with IPOs] means there is no support and resistance levels on a chart". This is the situation with Facebook stock right now. I am not sure where the stock is going to bottom out. To answer this question, I look at the chart above and I basically just eyeball it and try to imagine what price level it will drop to based on the volatility of the stock in the recent past. Based on it's volatility, I can see the stock dropping to the 14-17 area. It should be noted that I am only referring to the bottom that the stock will hit on this partiular down move over the coming 2 to 10 days - not where the stock is going over the enxt few months (let alone the long-term). Below, I create a table of general probabilities of where the stock will drop to.
- 17.00 - likely (70%)
- 16.00 - maybe (60%)
- 15.00 - maybe (40%)
- 14.00 - probably not (20%)
The probem is, though, that 14-17 is a pretty wide range. In this case, I think I will probably scale into the trade. I think I will buy in half of my position at 16, and the other half at 14 or 15. Normally, I don't do this, but I would probably do it in this scenario since: (1) the stock is volatile (2) and it doesn't have any trading history below 19.
If I do buy it, then next question is, "How far will it bounce after it bottoms out"? Over the past month, the stock has been making 10% swings over 4 to 5 day periods - so that is the minimum I think it will boune back. The most the stock may bounce would probably be 20-30% over 2 to 3 weeks. It may make a move back up towards 30, but that would be considered more of a new uptrend, rather than merely a "bounce-back". In general, the sharper a stock jumps back, the more quickly I am to sell it. If I get in at a low enough price (around 15-16), I think I would be happy with closing out the trade for a 10% gain if the stock jumped that much in 1-3 days. If the stock moved up more slowly, I might be willing to look for a 15-20% gain over 5 to 10 days.
August 5, 2012 - 4:14 am (PST)
In a previous journal post on July 8th, I posted a valuation on Facebook where I stated that the stock was overvalued. One of my main points was that the stock had a lot of potential downside because the estimated "revenue growth may be inaccurate because their revenue growth rate does not show deceleration" - and I thought this was a mistake by the market. I stated that I "wouldn't be surprised if they announced an earnings revision for 2013 later this year based on slower-than-expected growth".Just this week, there was news out that Facebook's reveune estimates were revised downwards - and therefore, their revenue growth rate also. You can see the headlines below.
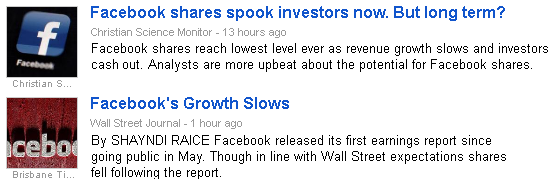
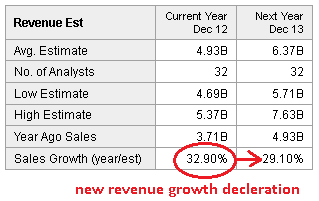
You can see below how the revenue growth rate now has a 4% point deceleration, whereas the previous revenue growth rate showed a 0% deceleration.
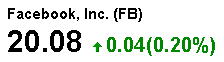
Since my previous journal post, you can see that the stock has decelined from 31 to 20, which is much closer to my value estimate of 19.
July 8, 2012 - 9:44 pm (PST)
Sometimes it is good to calculate the value of a company just to practice your valuation skills. Although I typically don't care much about high-profile stocks or IPOs that have received a lot of attention, sometimes I like to look at them out of curiosity. Facebook is an obvious example because of its hype. Here is a quick back-of-the-envelope calculation of the value of Facebook stock using my valuation process.
The first step I do is create a base of earnings to apply a P/E multiple to. Since we are halfway through 2012, the earnings estimates for the full calendar-year 2012 earnings will do. They are $0.51. If today's date were close to the end of the year, I would probably use a blend of 2012 and 2013 earnings estimates.
The second step I do is calculate the P/E ratio to multiple against the just-calculated earnings. This is a multi-factor subjective process.
The first thing I look at here is the revenue growth rate. This year's revenue growth is 31.9% and next year's growth rate is 31.8%. By combining these, I come up with a blended revenue growth rate of about 32%. If their revenue growth rate decelerated a lot into next year (say, from 31% to 15%), it would be a lot harder to come up with a blended growth rate.
The second thing I look at is the earnings growth rate. With an internet company like Facebook, I expected that the earnings growth rate would be larger than the revenue growth rate based on the assumption that the company would possess economies of scale. I am somewhat surprised to see that the earnings growth rate is lower than the revenue growth rate. This is somewhat understandable though, since Facebook probably ran on more of a shoestring financial budget in the old days and has since scaled their employees very quickly. Although the earnings growth rate for this year is only 19%, next year's growth rate of 28% is much higher - and closer to its revenue growth rate of 31%.
I blended the revenue and earnings growth rate together using a weighted average to come up with the P/E ratio. I weighted next year's earnings more than this year's since that number matters more and seems more representative of its growth. I multiplied the revenue growth rate by 3 in order to give it the same weight as earnings growth. I came up with a multiple of 28.5. See below:
- this year's earnings growth rate (19%) times 1
- next year's earnings growth rate (28%) times 2
- revenue growth rate (32%) times 3

Next, I add the amount of net cash per share to the value. Facebook, as you can see in Yahoo Finance's numbers above, has $3.91 billion in gross cash. When you subtract the $700 million of debt, the $1.83 in gross cash per share gets lowered to $1.50 net cash per share. When we add this $1.50 to the previous value of 17.09, we come up with $18.59.

Although the technical picture of a stock doesn't influence the fundamental analysis of a stock, it sometimes helps to see whether a stock is at the higher or lower end of its recent trading range in order to see if a stock's current valuation is at an abnormally high or low level relative to its historical valuation. In the case of Facebook, the stock is trading in the middle of its (admittedly-brief) historical range. So there is no reason to adjust its valuation because of it being in a technically overbought or oversold level.

Conclusion:
At 31.70, Facebook stock is overvalued by roughly 70%. It should be noted that this is just a fundamental valuation of the stock, and not a prediction of the stock. I don't know where the stock will be going and that is not the purpose of this post.
Notes:
Although the point of this exercise was not to get into a comprehensive analysis of the various subjective issues that affect Facebook's stock value, I might as well point out a few since I am already on the subject:
- The estimates of their revenue growth may be inaccurate ecause their revenue growth rate does not show deceleration. Since Facebook's revenue is close to $5-$6 billion, they are getting to the size where they should be showing deceleration in growth. But they aren't. I wouldn't be surprised if they announced an earnings revision for 2013 later this year based on slower-than-expected growth. The main counterargument to this point is below.
- Their ability to monetize their website will increase. Facebook initially concentrated on building traffic without monetizing the user experience and turning users off. But their ability to monetize their traffic is getting better, and will probably just increase in the future as they find new profit channels (games, gambling, whatever).
- The market generally assigns higher P/E ratios to internet stocks. Stocks like AMZN seem to be perpetually over-valued. Facebook may be this kind of stock. So even though it is overvalued by roughly 70%, this premium may be based on secular over-valaution rather than temporary over-valuation.
February 8, 2012 - 7:19 pm (PST)
EA dropped after hours, after the CFO left the company. We'll see what happens tommorow. GRPN (GroupOn) dropped about 15% after-hours. When looking at my "Watch List" over the past couple of months, one of the obvious possible trades was to write call credit spreads on GRPN and LNKD since they are overvalued. And even though this over-valuation presents an opportunity, the problem is that these stocks are overpriced based on irrationality. And a mis-valuation based on irrationality is harder to predict than a mis-valuation which occurs in a more benign emotional environment (i.e. a sutuation where a stock just "happens" to be overvalued). Because of this, I held off on writing those spreads. This is an area I plan to explore more in the future.February 5, 2012 - 4:27 pm (PST)
With the unemployment hitting a possible tipping point, it's possible that the market may be ready to enter an intermediate-term uptrend. I need to be careful about selling call credit spreads on stocks that are short-term overbought because they may continue to run up more. This happened to me in 2003. After the market made it's major bottom, it rose to where it was short-term overbought. I shorted a few stocks (YHOO and NET if I remember correctly) but they continued to rise. During my post-mortem analysis of my losses, I realized (when I looked at the weekly charts) that the stocks were not overbought on a longer-term basis. This is similar to what's happening now in some ways. The market is now making new multi-year highs which would seem, on the surface, to mean that stocks are overbought. But the market has spent a considerable amount of time (virutally all of 2011) consolidating near these highs. So this trend may continue for while.February 2, 2012 - 1:02 pm (PST)
EA and BMC were both up about 6% to 7% after earnings, which was good. The EA spread I sold at 0.20 is down to 0.05. Since the spread is for March expiration, I can get a better return on that money going forward by getting out and selling another spread for a 25% return so I may do that.XHB was unfortunately up another 22 cents to 19.45.
GOOG was a little more and TLT was fine.
The only notable move was that ANF was down about 14% from 47 to 40.36 based on earnings-related reasons. My spread is the 39/38 spread so it is still out of the money. The spread I wrote at 0.18 only went up to 0.26. I had a feeling that ANF might drop on bad earnings news, which is why the spread I wrote for my mom;s account had a 3-strike difference. Instead of writing a 43/42 spread (which I probably would have done about 100-lot), I did a 35-lot in the 43/40 spread. This allowed me to get a 23% return while doing a smaller options volume. Sometimes I write a spread so large that I don't have enough money to take delivery of the stock. In specific times (like this one), I will purposely write the spread with wider strike prices and do a smaller volume in order to ensure that I have enough money to take delivery of any stock thatI get assigned.
February 1, 2012 - 9:41 pm (PST)
EA was up 1 point after-hours after their earnings release. BMC looks unoved after its release. XHB was up .57 to 19.24 so my spread is in-the-money again - not a huge deal.TLT, after going up for a few days and getting a little too close to my strike price, had a nice decline of 1.38, and was down even more intra-day. Although I am feeling better about it, the high - and somewhat inexplicable - volatility is still a considerable risk factor. A daily range of 30-40 cents would make me feel better than daily 2 point moves.
This high volatility is due to bullish and bearish forces facing off against each other. Although this duality of simultaneous bullish and bearish forces is not uncommon, these occurances are usually driven by technical factors. More specifically, one of the most common times these situations occur is when a growth stock has been going up for quite some time (perhaps a year or more) and is reaching a point where it is clearly overbough and possibly overvalued. Many contrarian traders come in and short the stock (expecting a pullback to occur), while opposing momentum traders buy the stock (expecting the new highs to lead to more new highs). One specific example - and perhaps the most well-known example - of this duality would be Netflix's (NFLX) extended and volatile consolidation last within the 200-250 range last year (2010).
TLT is a little unique because it is one of those relatively rare times in markets where there are polar forces facing against each other that are based predominantly on fundamentals. Bond bulls are going long based on the assumption that a Greece default will cause an unprecendented global meltdown; while bond bears are pointing to the fact that interest rates are at record-low levels while the economy will be rebounding in the future.
January 31, 2012 - 9:00 pm (PST)
XHB was down more to 18.67, which is good. And GOOG held up. EA and BMC were both very strong today and are 15% and 20% away from my strike prices, respectively. This gives me a decent buffer if I decide to hold them through earnings tommorow.TLT was up another 1.38 to 120.85. There didn't seem to be any particularly bad news to make TLT jump this much in 2 days. It is probably traders placing bets against Greece. If TLT jumps more, it will definitely start to make me a nervous.
I wanted to (and was about to) sell 200-lot of the March SCHW 11/10 put credit spread at 0.30. Even though the stock is very close to the strike price, I think it is undervalued and I wouldn't mind taking delivery of 20,000 shres of SCH at 11.00. The market moved away before I could get the order in though.
January 30, 2012 - 4:00 pm (PST)
The only 3 positions of mine which mattered to me going into today were: XHB (because it is slightly in the money), GOOG (because it is a large position and not too far from the money), and TLT (because it is a large position in a voltile security).XHB was down and closed under my 19 strike, which was good. GOOG held up. TLT was up about 12.5 points to about 119.50. This wasn't bad by itself, but I don't want it to remain strong going forward.
January 27, 2012 - 6:00 pm (PST)
XHB up a bit again to 19.20. EA and ANF were up good.TLT and GOOG are the 2 positions which I care about now. My other ones are either doing fine. TLT was up a bit more. GOOG rebounded like I thought it would. It was up about 11.5 points.
Things are going very well right now. EA and BMC both have earnings on Wednesday after the close. FOSL has earnings on the 14th before the open. I have to decide whether I want to hold positions into those earnings.
January 26, 2012 - 6:45 pm (PST)
Relatively quiet day. XHB dropped back down to 19.05, and, more importantly, made a daily reversal after trading up to 19.55.TLT rebounded 1.5 points, which is very good. The good unempolyment claims number that came out today increases the risk of a bond market drop over the next month or so, but it will also help neutralize a jump in the bond market due to any bad news out of Greece. GOOG was down another 1.5 points. Hopefully it has hit bottom.
January 25, 2012 - 6:00 pm (PST)
Minor stuff: XHB was up about 40 cents to 19.30. My spread is back in-the-money so I hope XHB gowe back down. FOSL and BMC were up even more. ANF rebounded more.At the FOMC meeting today, the Fed didn't come out with any notable news. But the TLT was still (inexplicably) very volatile. It jumped 2.5 points and then came all the way back down and closed down a little.
GOOG was down about 11.5 points to 569.49. I definitely should have held off for a couple of days to write that put spread. One of my most effective techniques is to look at a stock which had a large 1-day drop (like 10%-40%) and then to hold off for about 2-4 days while the stock drops even more. Many times, traders will buy the initial drop thinking that the stock has bottomed out. But this initial gap down serves as a fake-out while the stock drops more for a couple of days. I think GOOG will bounce from here about 10 points or so and my spread will be 20 points out of the money. What GOOG stock does after that (and for the next 3 weeks before expiration) will be the key question.
January 24, 2012 - 6:00 pm (PST)
Nothing major happened today.The good. BMC was up more. FOSL up another 2.5 points to new recent highs. I may look at getting out of both spreads. ANF rebounded 1.5 points. TLT was about even, which is good.
The bad. XHB back up 30 cents to 18.90. GOOG was down 4.5 points.
January 23, 2012 - 6:00 pm (PST)
I got out of the rest of my SCHW spread at 0.03.Since XHB is up near its highs and I only had a small position, I wrote a 20/21 call spread to add to my 19/20 call spread. I tried to do 200 but only got filled on 50. Since I already have a 19/20 call spread written (a 200-lot), this had the effect of turning 50 of my 200-lot from a 1-point spread (19/20) into a 2-point spread (19/21).
The XHB has been so strong lately that I think that it probably won't drop too much even though it is overbought. So I wrote put spreads on it and turned my call spraeds into an iron condor.
My trades today:
- Bought to close 199 SCH February 10/9 put spread at 0.03
- Sold to open 50 XHB February 20/21 call spread at 0.15
- Sold to open 200 XHB February 16/17 put spread at 0.08
- Sold to open 50 XHB February 15/17 put spread at 0.12
GOOG was even today.
January 20, 2012 - 4:00 pm (PST)
I got out of 135 more of my SCHW spread at 0.03. I still have 199 on. BMC was up a lot today and I might look to get out of that. ANF was down sharply but is holding support.XHB dropped about 50 cents and my mom's 19/20 call spread expired out-of-the-money.
GOOG was down about 65 points today to 585. I wrote 100 of the February 560/555 put spread at 0.94 (I wrote 20 for my mom's account). It is a little close and I am wondering if I was too quick to put on the trade, but we'll see what happens.
TLT was down another 1.32 today to about 117. My call spread is doing very well but my put spread jumped to about .23. I definitely should have waited until now to write the put spread and should have done the 110/109 spread. I think the market is actually getting oversold now and will bounce sometime over the next few days. I would like volatility to go down too. I don't want the market to move a point and a half every day.
My trades today:
- Bought to close 135 SCHW 10/9 put spread at 0.03
- Sold to open 100 GOOG 560/555 put spread at 0.94
January 19, 2012 - 5:00 pm (PST)
SCHW was up a lot today so I tried to get out of my spread. I was able to get filled on 116 out of the 450 at 0.03.EA (Electronic Arts) was down a lot today. It is oversold, at support, and is undervalued so I wrote 310 EA March 16/15 put spread at 0.20. This isn't one of my favorite companies to play because I don't know it too well (Although I made some money on it last year) so I only put on a medium-sized position.
XHB stayed up there. Tommorow I may have to take a loss on it for my mom's account.
My new trades today:
- Sold to open 310 EA March 16/15 put spread at 0.20.
January 18, 2012 - 7:30 pm (PST)
ORCL and FSLR were both up a lot today and I tried to get out of both of my spreads since there is not too much premium left in them. I got out of 420 out of the 500 ORCL spread (which I wrote at .22) at .03. I left on the other 80 since I wrote a call spread on those earlier so it wouldn't free up any margin to take off the other 80. I got out of my FSLR spread (which I wrote at .68) at .08.ANF was up a lot today (2 points to 47.40), which is good because my mom's credit spread was written at 43, which was only 2 points away before today's jump.
XHB was up about 65 cents today to 19.12. I have written 19/20 call spread for both my account and my mom's account. My spread is in the February options, but my mom's is in the January options which expire on Friday, so it will be good if XHB will drop below 19 by Friday's close. If I have to take a loss then it won't be a big deal because both trades are only medium-sizd trades.
TLT was down about a point and a half today to 120, which was very good. I have some breathing room between the market and the 123 strike price.
While the market was down, I wrote 600 of the 113/112 TLT put spread at .09 and turned my call credit spread into an iron condor I also wrote 60 of the TLT out spread at 0.08 for my mom's account. Interestingly, I started to get filled on my spread at 0.09 before my mom got filled at 0.08 (see the picture below).

I wanted to write out spreads on NYX, NTAP, and EA about an hour before the close but they all jumped before I had the chance.
My trades for today for my account:
- Bought to close 420 ORCL 23/22 out spread at 0.03
- Bought to close 100 FSLR 26/23 put spread at 0.08
- Sold to open 600 TLT 113/112 out spread at 0.09
VNM has been up a lot lately - about 10% in a week and a half. I was right about that market even though I didn't make money. My VNM trade is a great example of a really bad trade. I had a correct hypothetsis but bad execution (although I made about 3% on my mom's account in 1 week, which is decent).
January 17, 2012 - 8:00 pm (PST)
TLT ticked up about 50 cents. It hasn't broke above the resistence (the old highs) from 2 weeks ago, but since I am close to the money and I have a max loss on this trade of almost $40,000, I am a little nervous.The rest of my trades were fine.
January 16, 2012 - 7:00 pm (PST)
The market was closed today but since it is Monday, the global markets are open. The European markets brushed off the downgrades from Friday, which is good for my position in TLT, but this article talks about how the markets care more about how the situation in Greece is going to play rather than the downgrades.January 13, 2012 - 9:00 pm (PST)
ORCL, SCHW, and ANF were all fine. FSLR seems like it might be on the verge of a breakdown back in the 30s. My spread is at 26 so I am not particularly worried. XHB was down 22 cents like I thought.I've been trying to get out of my SCHW spread @ 0.03 and ORCL spread @ 0.05 but they aren't getting filled. Since ORCL is up so much, I entered an order to write a 500-lot call spread and turn my put spread into an iron condor. I only got filled on 80 of them. As far as new trades, I put on a large position in TLT (and ETF that tracks the 20-year Treasury Bond). Here are my trades today:
- Sold 80 ORCL February 30/31 call spread @ 0.07
- Sold 600 February TLT 123/124 call spread @ 0.35 for my account
- Sold 60 February TLT 125/126 call spread @ 0.25 for my mom's account
Here is the intraday chart which shows where I got in.

I almost didn't get filled on the order because I had the order in at 0.36 and wasn't getting filled. I wanted the market to tick up a bit and trade into me, but I didn't want to lose out on a fill, so I lowered the order to 0.35 and got filled. This is important to point out because there have been many times when I will lose out on a fill because I am waiting on an extra penny on an options spread. If I am selling a spread at 0.10 then an extra penny can be enough to hold out for since you are getting 11% more premium selling the spread at 0.10 instead of 0.09 - but at 0.35 an extra penny is only giving you 3% more premium.
I am a little nervous about the TLT spread because I think I might have wrote it a little too close to the money. There are times where you can get "premium greedy" and going to close to the money to get a high return on your margin. I am also worried about the low volatility in the market right now. I shorted the TLT because I thought its large rise over the last few months indicated that the bond market has now reached a top (within a couple of points). But low volatility is often a precursor to a large move - and if either the stock market or the bond market itself became highly volatile, this could trigger the bond market to take another leg up into uncharted territory. The following chart shows the rise in the TLT (the black line) vs the VIX (the blue line).

This second chart shows the rise in TLT vs the large drop in the implied volatility of TLT options (a measure of the expected volatility of TLT itself).

To further compicate things, after the close, a WSJ blog post cited a bunch of downgrades in the Eurozone. Hopefully this news was already priced into the market. I believe it is.
January 12, 2012 - 7:00 pm (PST)
SCHW, ORCL, FSLR, and ANF were all fine. BMC was up about 3%. FOSL was up about 7 points to so (about 8%). XHB was even. I'm lokoing for it to drop over the next couple of days.For my mom's account, I put on the same FOSL trade as I did for my account yesterday.
- Sold 20 FOSL 70/65 put spread @ 0.85. I was able to get filled before it rose.
January 11, 2012 - 6:00 pm (PST)
SCHW and FSLR were up more today. ORCL was about even. The spreads are trading for such low values (about 3% to 6%) with 5 and a half weeks that I am thinking about buying them back and re-deploying my money in other positions. I'm not sure yet though.The XHB spread closed up 30 cents to 18.65. This is getting close to the money, but I'm not worried yet. BMC was fine.
I put on the following new trade:
- Sold 50 FOSL (Fossil) 70/65 put spread @ 0.85. Normally, I write put spreads on stocks that are sharply oversold. But this is one of those trades where a stock has fallen and traded sideways and looks like it has built a base and is looking like it will rise even though it is not sharply oversold.
- Sold 350 ANF (Abercrombie & Fitch) 39/38 put spread @ 0.18. This is the trade I should have put on my mom's account a few days ago. I should have waited for the stock to drop a couple of points.
- Sold 60 XHB 19/20 call spread at 0.11.
January 10, 2012 - 5:00 pm (PST)
VNM gapped up and traded around 14.95 for quite a while. Although I wanted to get out at 14.98, there were only a few prints at that price and I knew it would be hard to get filled on 7,900 shares so I put in an order at 14.95 and got filled there for a small $220 loss. My previous options trades (ORCL, FSLR, SCHW) were up more.With money freed up from VNM, I also put on 2 more options trades:
- Sold 118 (partial fill on an order for 350) BMC 29/28 put spread @ 0.18
- Sold 200 XHB 19/20 call spread @ 0.25
My mom's account: BMC and ANF were down a little but not too much.
January 9, 2012 - 4:00 pm (PST)
My account: My option trades (ORCL, FSLR, SCHW) were either up or even. VNM was up another 20 cents to close at 14.60. I am looking to get out tommorow at breakeven if it has another decent up day.My mom's account: I sold her 2,800 shres of VNM at 14.55 for a quick 2.5% profit in 2 trading days.
BMC was down a little more. ANF traded down a dollar but closed up a dollar.
January 6, 2012 - 3:00 pm (PST)
I knew VNM would gap down today based on the Vietnamese market trading down overnight. I put in a limit order for my mom's account for 2,800 shares at 14.20 before the market opened.VNM gapped down and I got filled right away. VNM traded higher and closed at 14.40. Even though it was only up 8 cents (0.5%), there were 2 big positives. First, it was up even though the Vietnamese market was down, so the ETF will liekly go up even more when the Vietnamese market rebounds over the next couple of days. And second, VNM make a daily reversal, signaling a multi-day rise from here.
My account: Mo options positions (ORCL, SCHW, FSLR) were either up more or even.
My mom's account: ANF was down another point. It is only 2 points away from the strike price with 6 weeks to go until February expiration. BMC was also down over 3% to 32 with the spread at 30.
January 5, 2012 - 2:00 pm (PST)
VNM was down about 1% today to 14.32. I'm looking for a nice bounce very soon. It it bounces from here it may get back to breakeven at 14.98. If it drops down to 1400 then it may only bounce back to 14.50 or so, at which point I will probably take a small loss.My account: My option positions (ORCL, SCHW, and FSLR) were all up alot.
My mom's account: BMC was up a little, but ANF was down even more - not good but not too bad.
January 4, 2012 - 8:06 pm (PST)
My account: VNM was down 1% today. Nothing big.My mom's account. My trades:
- Sold 35 of the ANF (Abercrombie and Fitch) February 43/40 put credit spread @ .57 for a 23% profit at expiration.
- Sold 50 of the BMC (BMC Software) February 30/29 put credit spread @ .18 for a 20% profit until expiration.
The BMC trade was a much smaller trade than I normally would have done. This is for 2 reasons: (1) BMC has earnings come out before expiration, so there is a decent chance of a large move (and therefore, large loss). (2) I haven't been in a postion to put on new options trades. After my December options expired on Dec 16th, I made a quick $18,000 or so in FSLR in about 2 days. I also wrote the following option trades for my account:
- 12/19/2011 - Sold 450 SCHW February 11/10 put credit spread @ .20 for a 24.7% profit at expiration.
- 12/21/2011 - Sold 500 ORCL February 23/22 put credit spread @ .22 - collecting $10,913 in premium for a 28% profit at expiration.
- 12/21/2011 - Sold 100 FSLR February 28/25 put credit spread @ .68 for a 29% profit at expiration.
But since then, I have felt like only trading part-time. I have been busy with other things and I haven't had time to do enough research in order to find new stocks to write options on. And my sleep cycle is not correlated to the market right now. I have made the mistake of putting on some large half-hearted options trades while not paying complete attention to the market in the past and getting burned.
January 3, 2012 - 8:50 pm (PST)
VNM was up 1.4% today. I got out of the position for my mom's account @ 14.65 for a very small profit. I plan on getting out of my tommorow if it is up a little more.December 30, 2011 - 2:00 pm (PST)
VNM was up 1.5% today. It was the first up day in about a week and a half. I'm looking for more mild gains next week.December 29, 2011 - 8:00 pm (PST)
VNM flat today. Vietnames stocks were up 0.3% tonight, so VNM will probably be up a little tommorow.December 28, 2011 - 8:00 pm (PST)
The Vietnamese market was even last night, so we'll see what happens tommorow.When I do sell VNM, it is not as important that I am watching the market all day to get the best price because most of the move in foreign stocks (ADRs) and foreign ETFs that trade in the U.S. will be a result of their moves the foreign market. The American shares are simply pricing in the (dollar-adjusted) move that the stock made in its home market overnight. Consequently, most of this move comes at the open, and the range after the first half hour will be very tight. The most common pattern is a big gap at the open and then trading sideways the rest of the day, like in the chart below of VNM over the last few days.

This is the first pure swing trade I have done in proabbly a couple of years. There have been a few times I have taken a position in stock, but only becuase I had options that I had written that were excersized by the buyer. I don't want to spend too much time in this trade because I want to get back to my option writing.
December 28, 2011 - 4:00 pm (PST)
The Vietnamese market (Bloomberg) were up about 0.5%, but the VNM ETF was down over 1%. It could have been currency-related since any foreign stock is both a stock and currency position rolled into one.December 27, 2011 - 4:00 pm (PST)
The Vietnamese market was down 1.4%. With yesterday's down move of 1% added on while the US markets were closed, VNM should have been down about 2.4%, but it was down about 3.5% today. I bought 900 more shares today for my own account at 14.56 for an average price of 14.98. I planned to buy more but I forgot that I had a bunch of option positions on. I don't think that I am going to be looking for a profit on this trade. I am probably just going to get out at break even since that is a 4% move up from here.I bought 3,500 shares today at 14.57 for my mom's account.
December 26, 2011 - 4:00 pm (PST)
Vietnam was down about 1% with the US markets closed.December 23, 2011 - 4:00 pm (PST)
I got filled at 15.03 - 1 tick off the post-open low. I'm only looking for a quick 2-3% jump, with only 2-3% risk. Normally I wouldn't bother with such a small gain/loss, but ETFs which are based on a very broad index (like the S&P - or a country index) don't ever gap down 20-40% like stocks such as NFLX or GMCR do, so there isn't much gap risk. The maximum daily risk tends to be around 1-3% - assuming you are not in a particularly volatile period. This allows a swing trader to play these indexes for small 2-3% gains over 1-2 day periods. I used to do with occassionally with the QQQ a few years ago. Barring any major currency-related crisis drop, things should go OK.December 23, 2011 - 9:58 am (PST)
The Vietnamese ETF (VNM) is making new 52-week lows. This is a market which is the fastest growing trading partner of America. Apparently, the market is heading down because of inflation pressures, which (from what I've read caused a currency devaluation some time in the past). I found it when scanning BarChart's new lows list. I have an order for 7,000 shares @ 15.03. I wouldn't mind averaging down to 14.75 next week. I'm just looking for a 3% (or so) move in a few days. I'm not concerned if I miss it. There is very little volume in the stock and the spreads are wide.Here are a few links:
- SeekingAlpha article on Vietnam that talks about the rise in consumer spending.
- Minyanville article that talks more about consuer spending.
- MarketWatch article that shows Vietnamese high growth.
- Seeking Alpha article which talks about the VNM ETF.
Journal Entries
- (Journal home)
- (All entries)
- (Latest entry)
- October 27, 2015
- September 14, 2015
- September 13, 2015
- August 13, 2015
- December 28, 2013
- October 27, 2013
- October 4, 2013
- August 28, 2012
- August 24, 2012
- August 23, 2012
- August 22, 2012
- August 21, 2012
- August 20, 2012
- August 19, 2012
- August 5, 2012
- July 8, 2012
- February 8, 2012
- February 5, 2012
- February 2, 2012
- February 1, 2012
- January 31, 2012
- January 30, 2012
- January 27, 2012
- January 26, 2012
- January 25, 2012
- January 24, 2012
- January 23, 2012
- January 20, 2012
- January 19, 2012
- January 18, 2012
- January 17, 2012
- January 16, 2012
- January 13, 2012
- January 12, 2012
- January 11, 2012
- January 10, 2012
- January 9, 2012
- January 6, 2012
- January 5, 2012
- January 4, 2012
- January 3, 2012
- December 30, 2011
- December 29, 2011
- December 28, 2011
- December 27, 2011
- December 26, 2011
- December 23, 2011

