
My Trading > My Trading Journal > October 27, 2013
My Trading Journal
October 27, 2013
5:21 pm (PST)
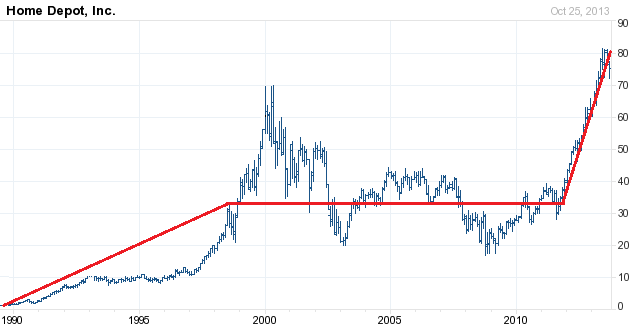
One of the patterns you can use to find high-quality long-term buys in the market is when a market or company that is a steady grower has a stock that trades sideways for a long time. The first example I will use is Home Depot (HD). If you look at the chart below, you will see the stock trade sideways from 1998 until 2012 while their revenue and earnings were growing steadily. After the stock broke out of this sideways trend, it went up from 35 to 80 - about 115% in 2 years.
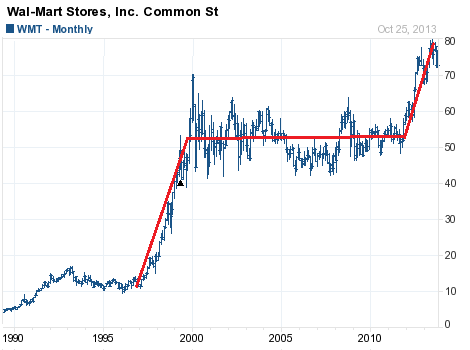
The second example, Wal-Mart (WMT), is shown in the chart below and is essentially a carbon copy of the Home Depot example. Both of these stocks were large cap stocks that went up too much in the late 90's as a result of the dot-com boom. Each stock had to consolidate sideways for about 5 years in order to digest those large gains. But, in these particular cases, the stocks ended up "over-consolidating" and trading sideways for too long. Hence, the underlying value of each of these companies ended up surpassing the price, and the price later jumped up quickly in order to catch up.
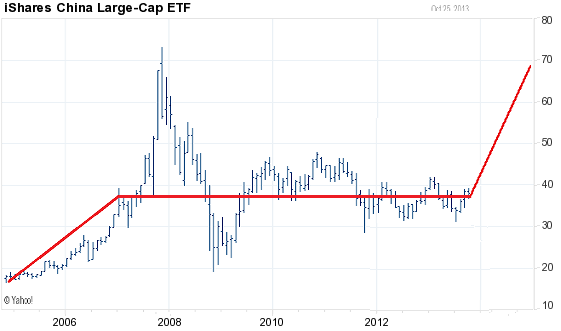
Fast-forward to today...One particular market that has been a steady grower is China. Their economy has maintained an 8-10% GDP growth for quite some time. In the chart below, you can see how the Chinese market (indicated by FXI, a Chinese ETF) ran up a lot from 2004 to 2008. But the market has been trading sideways for almost 7 years now. I'm not sure if the market is going to break out now or later. But given that the market is still in the bottom half of its 30-50 range over the last few years, this is not a bad entry if someone is looking to for an attractive buy-and-hold with a low-risk entry. If the market does break out to the upside, I would look for it to jump from its current 38, to about 65 - for about a 70% gain. With good momentum, it could do it in 1.5-to-2 years.
Journal Entries
- (Journal home)
- (All entries)
- (Latest entry)
- October 27, 2015
- September 14, 2015
- September 13, 2015
- August 13, 2015
- December 28, 2013
- October 27, 2013
- October 4, 2013
- August 28, 2012
- August 24, 2012
- August 23, 2012
- August 22, 2012
- August 21, 2012
- August 20, 2012
- August 19, 2012
- August 5, 2012
- July 8, 2012
- February 8, 2012
- February 5, 2012
- February 2, 2012
- February 1, 2012
- January 31, 2012
- January 30, 2012
- January 27, 2012
- January 26, 2012
- January 25, 2012
- January 24, 2012
- January 23, 2012
- January 20, 2012
- January 19, 2012
- January 18, 2012
- January 17, 2012
- January 16, 2012
- January 13, 2012
- January 12, 2012
- January 11, 2012
- January 10, 2012
- January 9, 2012
- January 6, 2012
- January 5, 2012
- January 4, 2012
- January 3, 2012
- December 30, 2011
- December 29, 2011
- December 28, 2011
- December 27, 2011
- December 26, 2011
- December 23, 2011
